NJ’s Momentum Factor - NJ Momentum+ Model
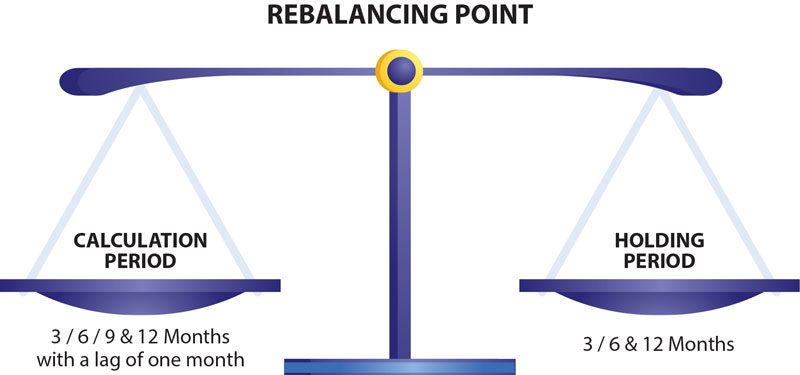
One of the concerns when using momentum is the propensity of a moving stock to “recoil” sharply when it reaches a turning point. The most popular way of overcoming this is to use a lag between the time when momentum is studied and when it is acted upon. This allows the “recoil”, if it happens, to manifest and lower the acquisition cost of the stock.
In developing our Momentum indicator, we studied various time periods between 1 and 12 months of standalone and comparative momentum. We studied these both with and without different lag periods from 5 days to 1 month. We also studied various holding periods for our resultant portfolio ranging from 3 to 12 months. In studying these, transaction costs were incorporated into the process to allow for a robust comparison of the outcomes achieved.
Our current methodology provides a balance between managing portfolio churn, factor decay, and scalability.
The NJ Momentum+ model combines the short term and long term momentum of a stock to rank it based on the combined score. It uses the past 3 months return to calculate the short term and the past 9 months returns to calculate the long term momentum. The NJ Momentum+ model chooses the Top 100 stocks with the highest momentum from the Nifty 500 index and constructs an equal weighting model.

Source: Internal research, Bloomberg, CMIE, National Stock Exchange, NJ’s Smart Beta Platform (in-house proprietary model of NJAMC). Calculations are for the period 30th September 2006 to 31st December 2025. NJ Momentum+ Model is an in-house proprietary methodology developed by NJ Asset Management Private Limited. The methodology will keep evolving with new insight based on the ongoing research and will be updated accordingly from time to time. Past performance may or may not be sustained in future and is not an indication of future return. The above is only for illustration purposes and should not be construed as indicative return of offering of NJ Asset Management Private Limited.
| Parameter |
1-Year Return (%) |
3-Year CAGR (%) |
5-Year CAGR (%) |
10-Year CAGR(%) |
Since Inception CAGR (%) |
| NJ Momentum+ |
-0.71 |
24.91 |
26.77 |
22.73 |
22.20 |
| Nifty 500 TRI |
7.76 |
16.71 |
16.88 |
14.76 |
16.46 |
Source : Internal research, Bloomberg, CMIE, National Stock Exchange. Data is as on 31st December 2025. Past performance may or may not be sustained in future and is not an indication of future return. NJ Momentum+ Model is a proprietary methodology developed by NJ Asset Management Private Limited. The methodology will keep evolving with new insight based on the ongoing research and will be updated accordingly from time to time.

Source : Internal research, Bloomberg, CMIE, National Stock Exchange of India, NJ’s Smart Beta Platform (in-house proprietary model of NJAMC). 5-Yr CAGRs are calculated for the period 30th September 2006 to 31st December 2025 and have been rolled on a daily basis. Past performance may or may not be sustained in future and is not indication of future return. NJ Momentum+ Model is a proprietary methodology developed by NJ Asset Management Private Limited. The methodology will keep evolving with new insight based on the ongoing research and will be updated accordingly from time to time.

Source : Internal research, Bloomberg, CMIE, National Stock Exchange of India, NJ’s Smart Beta Platform (in-house proprietary model of NJAMC). 10-Yr CAGRs are calculated for the period 30th September 2006 to 31st December 2025 and have been rolled on a daily basis. Past performance may or may not be sustained in future and is not indication of future return. NJ Momentum+ Model is a proprietary methodology developed by NJ Asset Management Private Limited. The methodology will keep evolving with new insight based on the ongoing research and will be updated accordingly from time to time.
As the charts indicate, momentum has been a consistent outperformer across various time periods which makes it one of the most important factors in India. Since it offers the widest range of options to calculate and determine its presence, implementations of momentum differ very widely across the world and even within India. Combined with its fickle nature, the search for the most efficient and consistent way to measure momentum promises to be a long one.

Source: Internal research, Bloomberg, CMIE, National Stock Exchange of India, NJ’s Smart Beta Platform (in-house proprietary model of NJAMC). CAGRs are calculated as the average CAGR based on the rolling CAGRs (rolled daily) calculated for the respective holding periods i.e. 1, 3, 5, and 10-Yr rolling CAGRs. The period for calculation is 30th September 2006 to 31st December 2025. Past performance may or may not be sustained in future and is not an indication of future return. NJ Momentum+ Model is a proprietary methodology developed by NJ Asset Management Private Limited. The methodology will keep
evolving with new insight based on the ongoing research and will be updated accordingly from time to time.

Source: Internal research, Bloomberg, CMIE, National Stock Exchange of India, NJ’s Smart Beta Platform (in-house proprietary model of NJAMC). The Return/Standard Deviation ratios have been calculated by dividing the respective rolling returns (rolled daily) by the standard deviation of the corresponding rolling returns, The period for calculation is 30th September 2006 to 31st December 2025. Past performance may or may not be sustained in future and is not an indication of future return. NJ Momentum+ Model is a proprietary methodology developed by NJ Asset Management Private Limited. The methodology will keep evolving with new insight based on the ongoing research and will be updated accordingly from time to time.

| |
NJ Momentum+ |
Nifty 500 TRI |
| Maximum Drawdown |
-65.11% |
-63.71% |
Source: Internal research, Bloomberg, CMIE, National Stock Exchange of India, NJ’s Smart Beta Platform (in-house proprietary model of NJAMC). Calculations are for the period 30th September 2006 to 31st December 2025. The Drawdown for a specific date has been calculated by dividing that day’s NAV of NJ Momentum+ Model and Nifty 500 TRI by their peak NAVs up to that date, respectively. Past performance may or may not be sustained in future and is not an indication of future return. NJ Momentum+ Model is a proprietary methodology developed by NJ Asset Management Private Limited. The methodology will keep evolving with new insight based on the ongoing research and will be updated accordingly from time to time.
