Performance of Multi-factor Models Across Markets: USA, Europe, and India
The performance of the Multi-factor index across the USA, Europe, and India highlights the effectiveness of combining multiple factors - Quality, Value, Momentum, and Low Volatility - into a single investment strategy. The historical data illustrates how the Multi-factor index has outperformed its respective benchmark over the long term, leveraging the strengths of individual factors while mitigating their cyclical downturns.
The NAV charts depict the relative growth of 1000 units of local currency investment in the Multi-factor index compared to the broad market benchmark, demonstrating its ability to generate superior risk-adjusted returns. The consistent performance of the Multi-factor strategy across different market environments underscores its robustness as a well-diversified approach to factor investing.
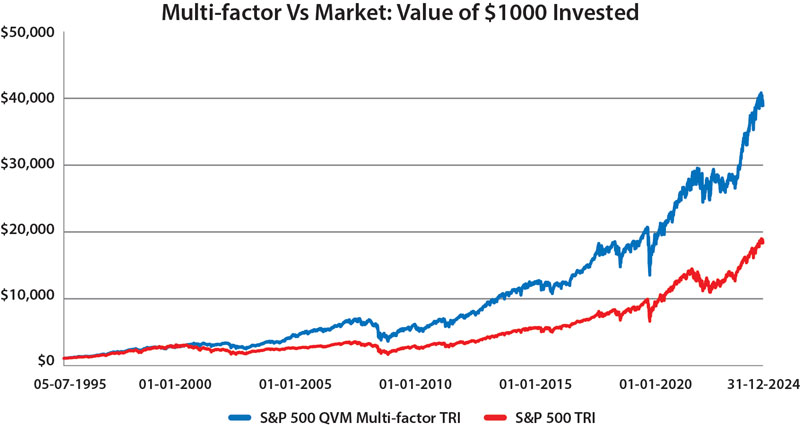
Source : Bloomberg. This chart depicts the growth in the NAV of S&P 500 QVM Multi-factor TRI vis-a-vis that of the S&P 500 TRI over the period 5th July 1995 to 31st December 2024. All the NAVs are in USD and have not been converted to INR. All the indices have been scaled to $1,000 as of 5th July 1995. Past performance may or may not be sustained in future and is not an indication of future return
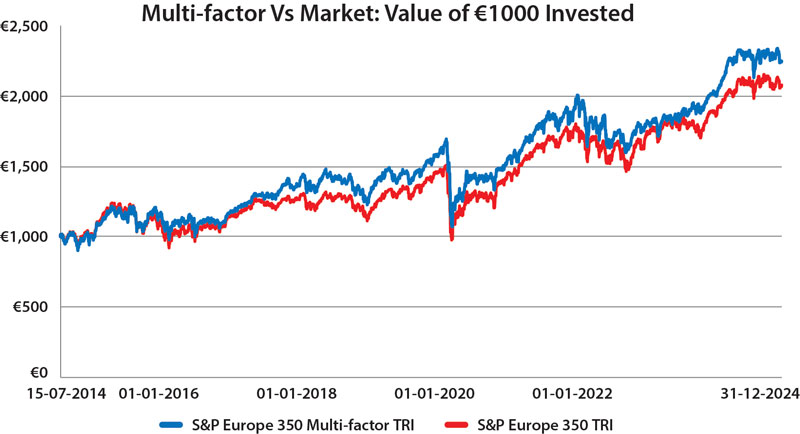
Source : Bloomberg. This chart depicts the growth in the NAV of S&P Europe 350 Multi-factor TRI vis-a-vis that of the S&P Europe 350 TRI over the period 15th July 2014 to 31st December 2024. All the NAVs are in EUR and have not been converted to INR. All the indices have been scaled to €1,000 as of 15th July 2014. Past performance may or may not be sustained in future and is not an indication of future return.
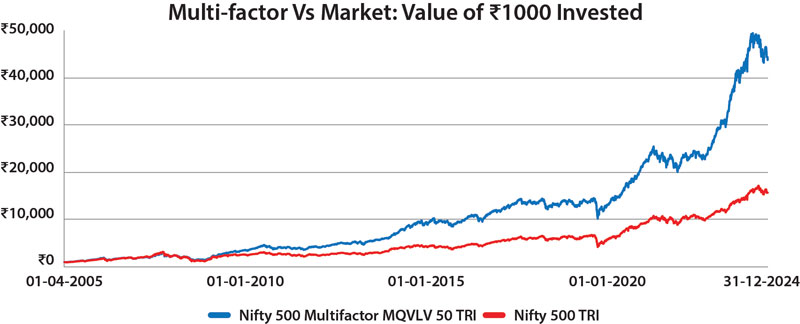
Source : NSE. This chart depicts the growth in the NAVs of Nifty 500 Multifactor MQVLV 50 TRI vis-a-vis that of the Nifty 500 TRI over the period 1st April 2005 to 31st December 2024. All the indices have been scaled to Rs.1,000 as of 1st April 2005. Past performance may or may not be sustained in future and is not an indication of future return.
Period-wise Summary of Factor Performance: Multi-factor Vs Market
| Region |
Period |
Annualised Return (%) |
3-Year Median Rolling Return (%) |
10-Year Median Rolling Return (%) |
| Multi-factor |
Market |
Multi-factor |
Market |
Multi-factor |
Market |
| USA |
Jul 5, 1995 - Dec 31, 2000 |
23.93 |
19.32 |
24.08 |
25.80 |
- |
- |
| Jan 1, 2001 - Dec 31, 2006 |
10.35 |
2.94 |
15.25 |
8.98 |
- |
- |
| Jan 1, 2007 - Dec 31, 2012 |
5.07 |
2.29 |
1.35 |
1.58 |
- |
- |
| Jan 1, 2013 - Dec 31, 2018 |
12.23 |
12.15 |
10.37 |
10.90 |
- |
- |
| Jan 1, 2019 - Dec 31, 2024 |
16.23 |
16.95 |
13.17 |
10.35 |
- |
- |
| Entire Period |
13.21 |
10.36 |
12.78 |
11.20 |
11.63 |
7.98 |
| Europe |
Jul 15, 2014 - Dec 31, 2018 |
5.24 |
2.97 |
7.93 |
3.61 |
- |
- |
| Jan 1, 2019 - Dec 31, 2024 |
10.20 |
10.55 |
8.71 |
8.99 |
- |
- |
| Entire Period |
8.06 |
7.25 |
8.30 |
7.60 |
8.67 |
7.60 |
| India |
Apr 1, 2005 - Dec 31, 2012 |
23.26 |
14.79 |
20.15 |
8.58 |
- |
- |
| Jan 1, 2013 - Dec 31, 2018 |
17.48 |
12.75 |
20.34 |
13.11 |
- |
- |
| Jan 1, 2019 - Dec 31, 2024 |
21.94 |
17.20 |
25.71 |
19.28 |
- |
- |
| Entire Period |
21.10 |
14.96 |
19.24 |
13.11 |
19.11 |
12.75 |
Source : Bloomberg, NSE. Past performance may or may not be sustained in future and is not an indication of future return. The S&P 500 QVM Multi-factor TRI, S&P Europe 350 Multi-factor TRI, & Nifty 500 Multifactor MQVLV 50 TRI are used to represent the Multi-factor index for the USA, Europe and India regions respectively. The S&P 500 TRI, S&P Europe 350 TRI, & Nifty 500 TRI are used to represent the Market index for the USA, Europe and India regions respectively.
