Performance of select quality parameters
At NJ AMC, an exhaustive examination of various quality parameters has been undertaken, revealing several robust metrics indicative of a company's financial robustness. Some of these metrics are Return on Equity (ROE), ROE Consistency, Dividend Payout Ratio, Debt-to-Equity, and Current Ratio Consistency. We would like to share an analysis of the comparative performance between high-quality and low-quality stocks as measured by these metrics. The findings demonstrate that high quality stocks have consistently outperformed their lower-quality counterparts and market indices over extended periods.
Presented below is the cumulative growth of Rs.1000 from September 2006 to December 2025 for both the top 100 high-quality and bottom 100 low-quality stocks, alongside the Nifty 500 Index, for respective quality parameters. The accompanying table displays the Compound Annual Growth Rate (CAGR), annualised volatility, 10-year median Rolling Returns, Maximum Drawdown and Cumulative Growth of Rs.1000. It is noteworthy to emphasise the superior risk-adjusted returns attained by high-quality stocks, assessed through diverse quality parameters, in contrast to low-quality stocks and the market index throughout this specified timeframe.
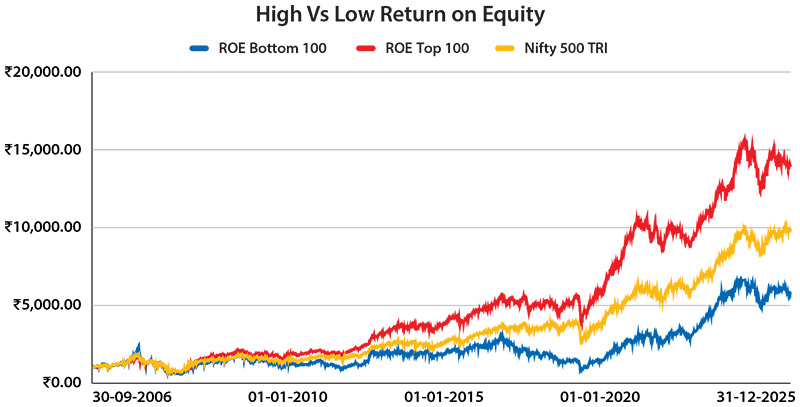
A.Return on Equity
- Return on Equity (ROE) measures how effectively a company generates profits from the equity invested by shareholders. A higher ROE often signifies superior financial performance and management efficiency, making it a valuable metric for assessing quality.
- ROE= (Net Income / Shareholders’ Equity) x 100
- Example: If a company has a net income of Rs.50 lakhs and shareholders’ equity of Rs.200 lakhs: ROE= (50 / 200)×100= 25%
This means for every Rs.1 of equity, the company generates Rs.0.25 in profit.
| From Sep 2006 to Dec 2025 |
CAGR (%) |
10 Year Median
Rolling Returns (%) |
Annualised
Volatility (%) |
Maximum
Drawdown (%) |
Cumulative
Growth of Rs.1000 |
| ROE Top 100 |
14.70 |
15.82 |
17.29 |
-63.94 |
Rs.14,061 |
| ROE Bottom 100 |
9.59 |
8.75 |
24.60 |
-76.55 |
Rs.5,837 |
| Nifty 500 TRI |
12.65 |
13.54 |
19.88 |
-63.71 |
Rs.9,929 |
Source: CMIE, NJ’s Smart Beta Platform. Data for the period 30th September 2006 to 31st December 2025. Past performance may or may not be sustained in future and is not indication of future return.
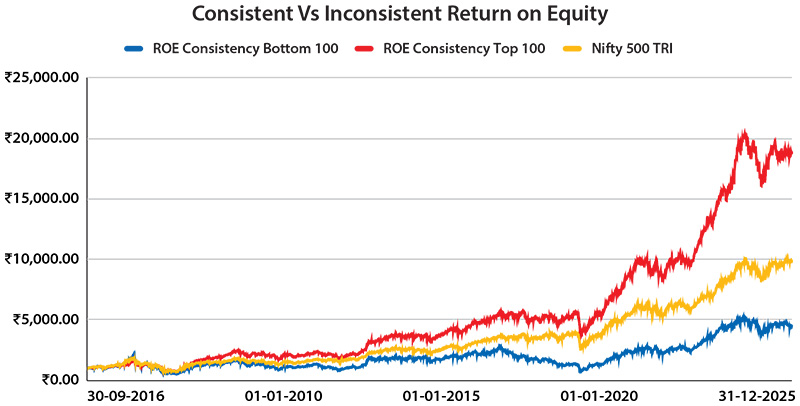
B.Return on Equity Consistency
- ROE Consistency highlights how reliably a company maintains its profitability over time, reflecting stability and a strong operational framework. Companies with consistently high ROE are better positioned to weather economic fluctuations, as shown in the graph comparing top performers to bottom firms and the benchmark index, Nifty 500.
- Example: If a company’s ROE for the last 5 years is 22%, 23%, 21%, 22.5%, and 23.2%, it shows consistent performance, suggesting stability.
| From Sep 2006 to Dec 2025 |
CAGR (%) |
10 Year Median
Rolling Returns (%) |
Annualised
Volatility (%) |
Maximum
Drawdown (%) |
Cumulative
Growth of Rs.1000 |
| ROE Consistency Top 100 |
16.48 |
16.21 |
17.58 |
-57.90 |
Rs.18,901 |
| ROE Consistency Bottom 100 |
8.17 |
7.77 |
24.53 |
-77.08 |
Rs.4,546 |
| Nifty 500 TRI |
12.65 |
13.54 |
19.88 |
-63.71 |
Rs.9,929 |
Source: CMIE, NJ’s Smart Beta Platform. Data for the period 30th September 2006 to 31st December 2025. Past performance may or may not be sustained in future and is not indication of future return.
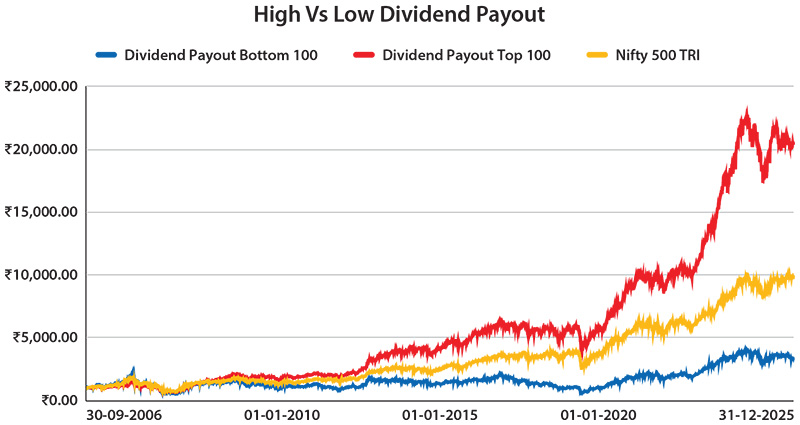
C.Dividend Payout
- The Dividend Payout Ratio demonstrates the proportion of earnings distributed as dividends, balancing shareholder returns with retained earnings for growth. Quality companies strike the right balance, rewarding investors while reinvesting strategically. The graph clearly illustrates how top companies outperform compared to their peers.
- Dividend Payout Ratio= (Dividends Paid / Net Income) x 100
- Example: If a company has a net income of Rs.40 lakhs and pays Rs.10 lakhs as dividends: Dividend Payout Ratio= (10 / 40)×100= 25%
This means the company pays out 25% of its profits as dividends.
| From Sep 2006 to Dec 2025 |
CAGR (%) |
10 Year Median
Rolling Returns (%) |
Annualised
Volatility (%) |
Maximum
Drawdown (%) |
Cumulative
Growth of Rs.1000 |
| Dividend Payout Top 100 |
16.99 |
17.65 |
17.08 |
-60.31 |
Rs.20,570 |
| Dividend Payout Bottom 100 |
6.51 |
4.99 |
24.39 |
-78.38 |
Rs.3,374 |
| Nifty 500 TRI |
12.65 |
13.54 |
19.88 |
-63.71 |
Rs.9,929 |
Source: CMIE, NJ’s Smart Beta Platform. Data for the period 30th September 2006 to 31st December 2025. Past performance may or may not be sustained in future and is not indication of future return.
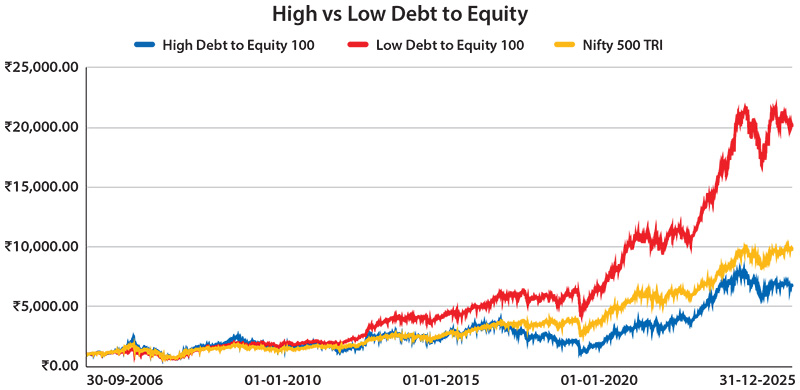
D.Debt to Equity
- Debt to Equity Ratio evaluates the level of financial leverage a company employs, showing how effectively it balances debt and equity to fund operations. A low ratio indicates a sound financial structure, while excessive debt can raise risk levels. Companies with low debt levels excel here by maintaining sustainable leverage, as evident in their graph performance relative to weaker firms and the broader market.
- Debt to Equity Ratio= (Total Debt / Shareholders’ Equity)
- Example: If a company has total debt of Rs.100 lakhs and shareholders equity of Rs.50 lakhs: Debt to Equity Ratio= (100 / 50)= 2
This means the company uses Rs.2 of debt for every Rs.1 of equity.
| From Sep 2006 to Dec 2025 |
CAGR (%) |
10 Year Median
Rolling Returns (%) |
Annualised
Volatility (%) |
Maximum
Drawdown (%) |
Cumulative
Growth of Rs.1000 |
| Low Debt to Equity 100 |
16.90 |
18.05 |
16.84 |
-60.49 |
Rs.20,280 |
| High Debt to Equity 100 |
10.49 |
8.67 |
24.61 |
-74.10 |
Rs.6,836 |
| Nifty 500 TRI |
12.65 |
13.54 |
19.88 |
-63.71 |
Rs.9,929 |
Source: CMIE, NJ’s Smart Beta Platform. Data for the period 30th September 2006 to 31st December 2025. Past performance may or may not be sustained in future and is not indication of future return.
